



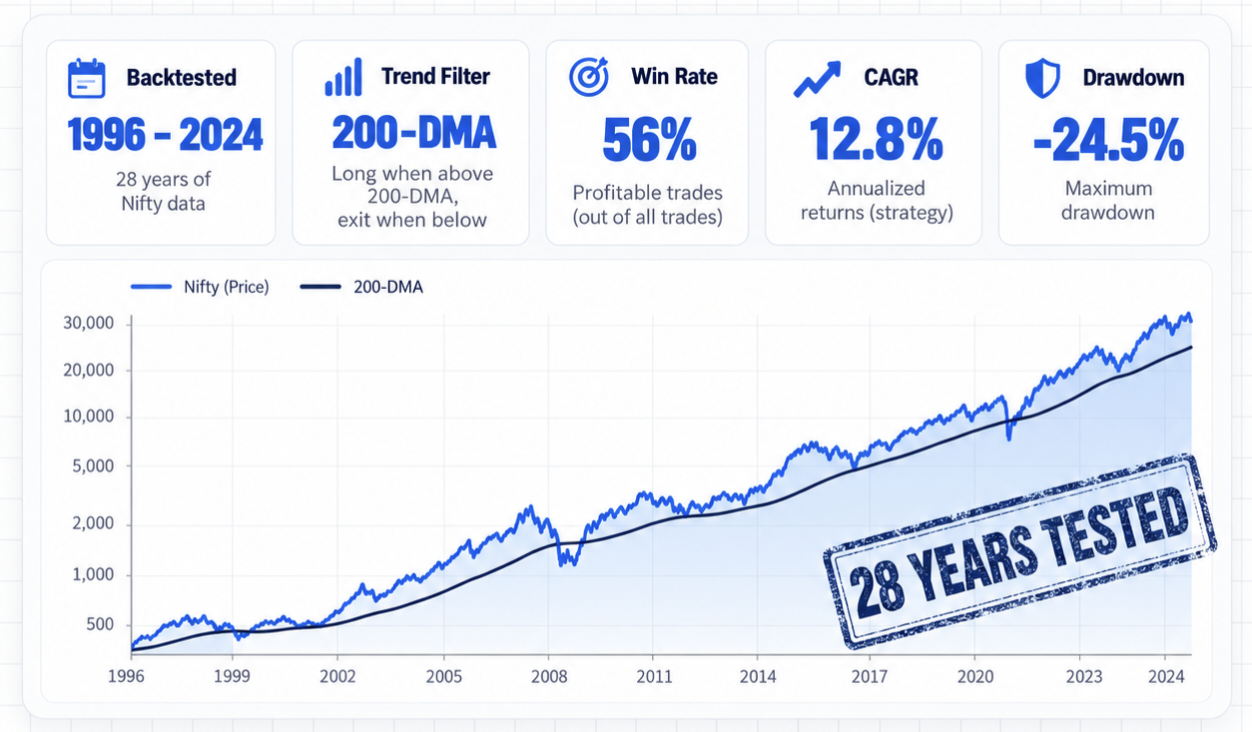
The 200-day moving average is one of the most watched levels in the entire Indian stock market. When the Nifty 50 closes below it, panic spreads across Dalal Street. When it reclaims it, bulls celebrate. But does the 200-DMA actually predict anything—or is it just a line on a chart that retail and institutional traders alike have been conditioned to care about?
To find out, we at TickerPulse analyzed 28 years of Nifty 50 data (1996–2024) to see what actually happens when the index closes below its 200-day moving average. The results were surprising.
The Setup: What Happens After Nifty Breaks the 200-DMA?
The 200-DMA is widely tracked by NSE and BSE market participants as a primary long-term trend indicator. When the Nifty closes above it, the broader market trend is considered bullish. When it closes below, the trend is widely perceived as broken.
But here's the question nobody asks: what happens next? Does the market continue falling into a protracted bear market, or does it bounce back?
We crunched the numbers on every instance since 1996 when the Nifty closed below its 200-DMA. Here's what the data revealed:
- 1-Month Performance: Average return of +1.5%, with 60.4% of instances delivering positive returns.
- 6-Month Performance: Average return of +8.4%, with 63.3% of instances positive.
- 12-Month Performance: Average return of +19.4%, with 70.2% of instances positive.
The pattern is clear: the longer you hold bluechips and broader index constituents, the better your odds. While the short-term reaction is volatile (returns as low as -39.3% have occurred during severe macroeconomic shocks), the 12-month view shows a robust 70% probability of gains.
The 200-DEMA Confirmation
A separate analysis looked specifically at the 200-day Exponential Moving Average (200-DEMA), which gives exponentially more weight to recent price action. The results were similarly encouraging.
Since 2018, every time the Nifty touched its 200-DEMA, it delivered:
- +3.0% after 1 month
- +5.5% after 3 months
- +9.3% after 6 months
- +17.6% after 12 months
The probability of positive returns also grew over time: 58% within a month, 83% within three months, and 91% within a year. In 10 out of 11 instances, the returns were positive over a one-year period.
The Critical Caveat
Here's where the data gets more nuanced. The -39.3% minimum return mentioned in the 1996–2024 study is a sharp reminder that mathematical averages can hide brutal outliers. The 2008 Global Financial Crisis and the 2020 Covid-19 crash both saw the Nifty fall well below the 200-DMA, and those who bought aggressively simply because the index crossed "below the line" without proper risk management would have suffered significant short-term drawdowns.
The 200-DMA is not a crystal ball. It's a probability tool. It tells you that historically, accumulating equities when the Nifty is below its long-term average has been rewarded more often than not—but it is never a certainty.
The Takeaway
The 200-DMA is not a magic signal. It's a technical level that reflects long-term market sentiment on the National Stock Exchange. The data shows that when the Nifty closes below it, the odds of positive returns over the next 6 to 12 months are significantly higher than the odds of an endless downward spiral.
But the data also shows that black swan outliers exist. The -39.3% drawdown in the study serves as a stark reminder that buying blindly is never a viable strategy. The 200-DMA is a tool for context, not a guarantee of returns.
If you're a long-term investor, the 200-DMA offers a statistical edge. If you're a swing trader looking for a quick market bounce, the odds are far less reliable. The question isn't whether the 200-DMA works—it's whether you have the financial patience and capital allocation to wait for the probabilities to play out.