



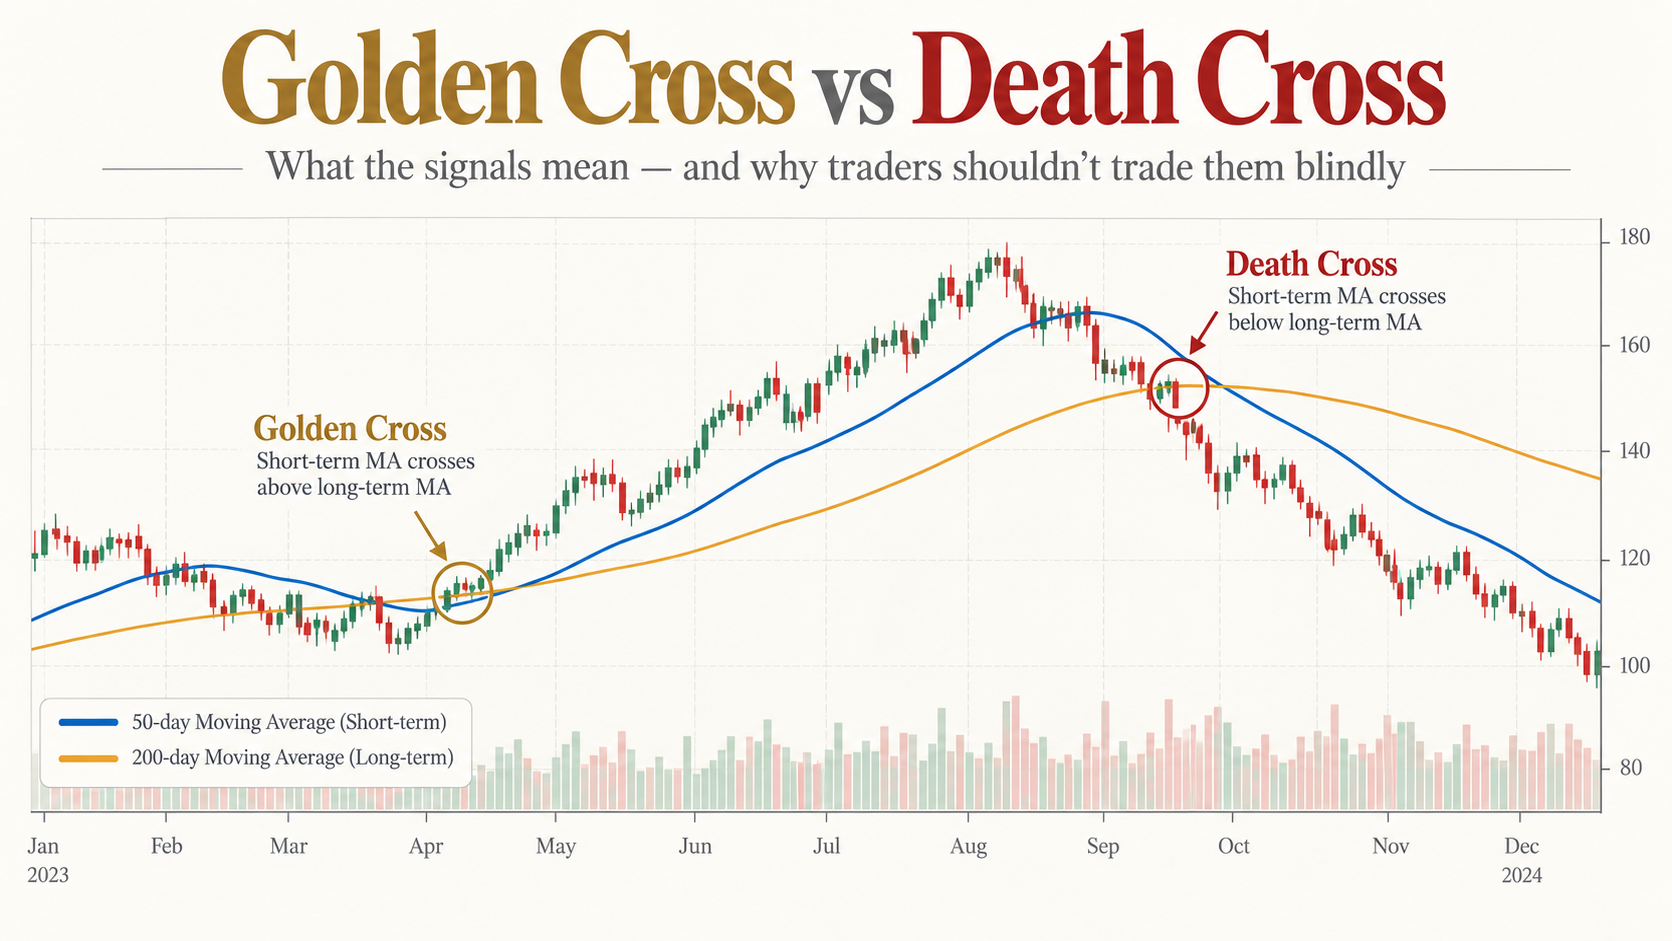
Every trader tracking the NSE and BSE has seen them on a chart. The moment a short-term moving average crosses a long-term one, financial headlines start screaming about a "Golden Cross" or a "Death Cross." But what do these signals actually mean for Indian equities, and more importantly, should you trade them blindly? Here is the simple breakdown of what they are, how they work, and the one critical mistake most retail investors make when using them.
The Basics: What Are Moving Averages?
A moving average (MA) is one of the simplest and most widely used indicators in technical analysis. It smooths out volatile price data over a specific period by creating a constantly updated average price, helping traders filter out market noise.
The two most common benchmarks watched by institutional desks are:
- 50-day MA: Tracks the short-term trend in bluechips and momentum stocks.
- 200-day MA: Tracks the long-term structural trend of major indices like the Nifty 50 or Sensex.
When these two lines cross, market momentum is considered to have shifted. That shift creates one of two famous signals: the Golden Cross or the Death Cross.
The Golden Cross: A Bullish Signal
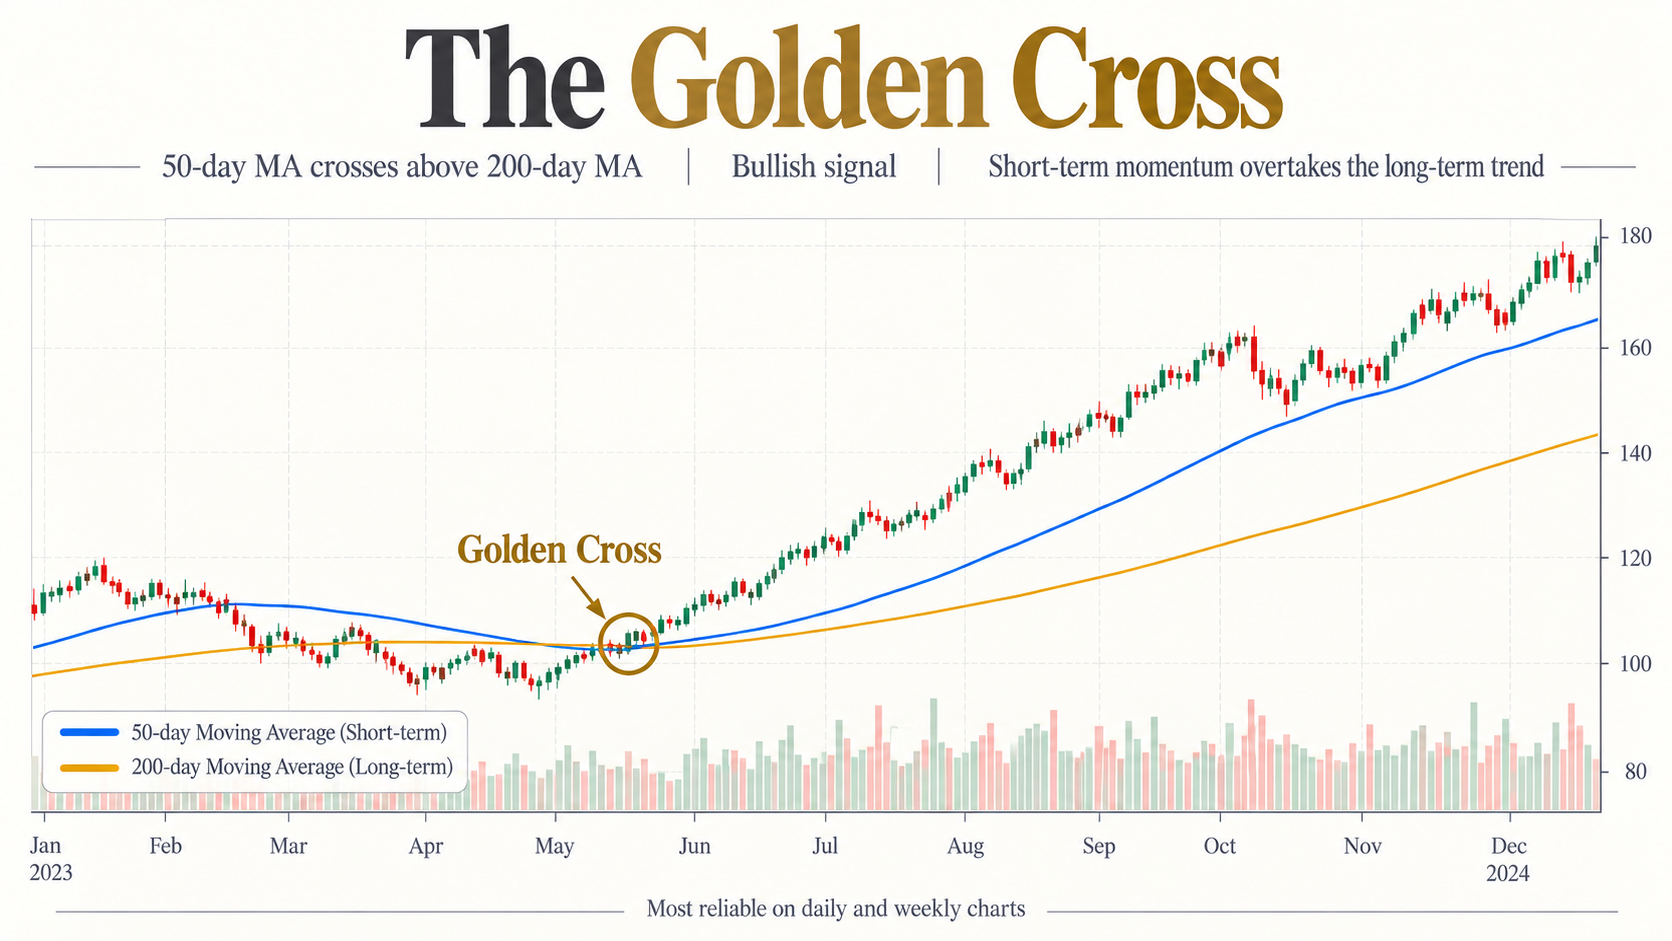
A Golden Cross happens when the short-term 50 MA crosses ABOVE the long-term 200 MA.
This is widely interpreted by technical analysts as a strong bullish reversal. It signals that short-term momentum has overtaken the long-term trend, and institutional buyers are taking control. Historically, across many major Indian indices and large-cap stocks, a valid Golden Cross has often preceded sustained multi-month rallies.
The Death Cross: A Bearish Signal
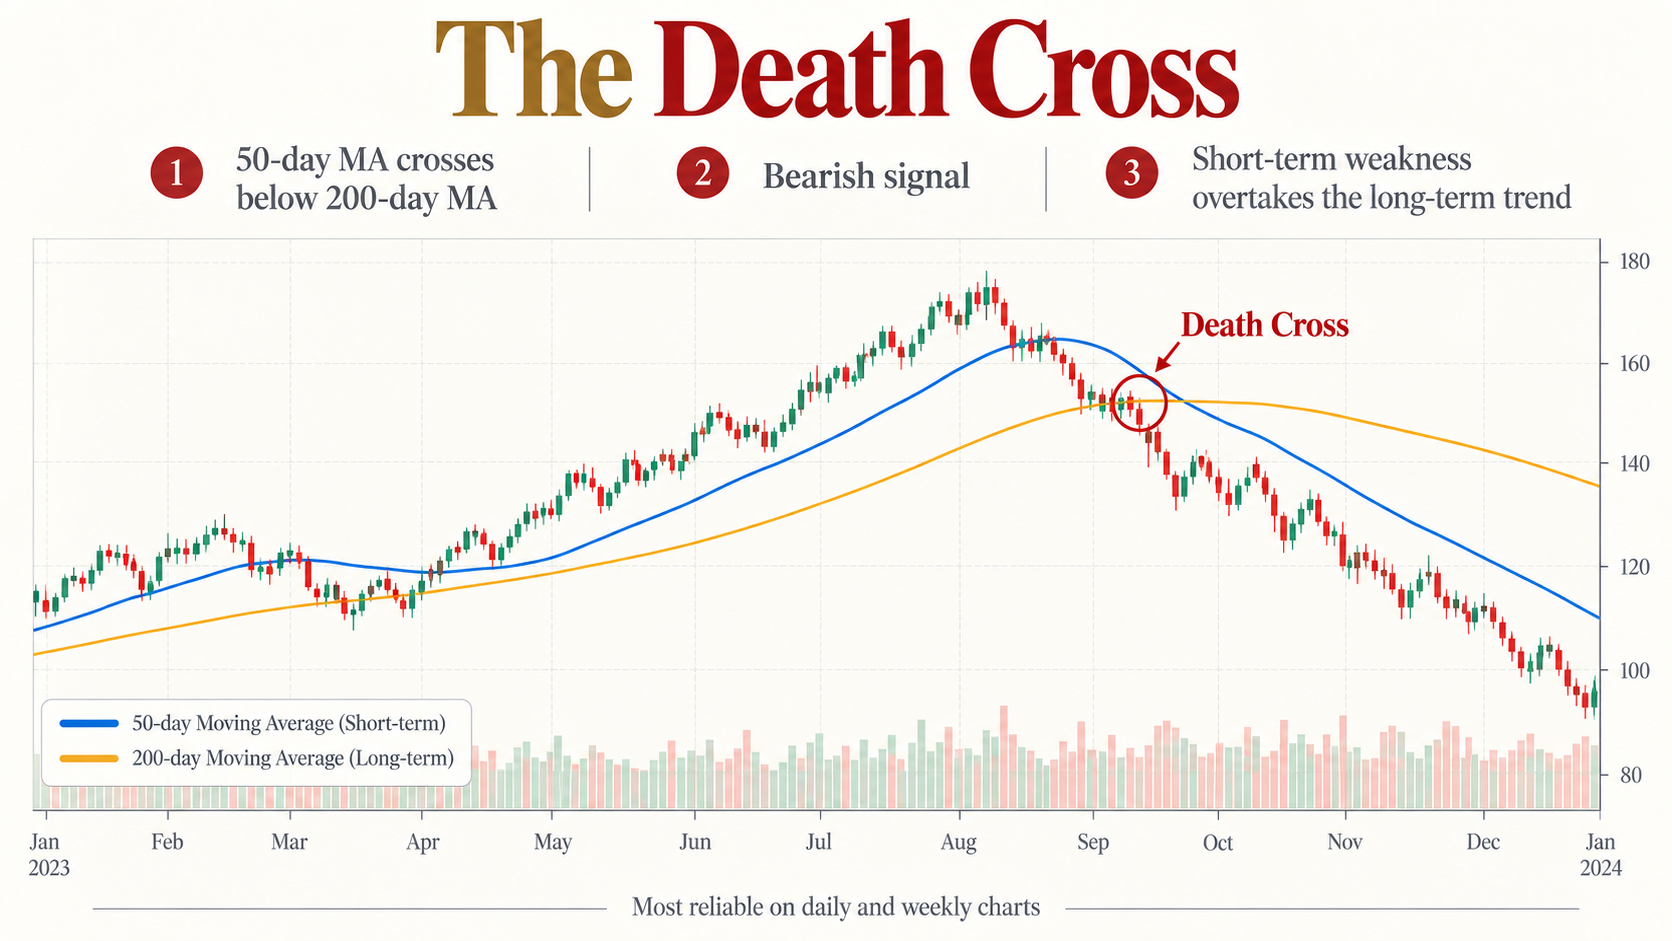
Conversely, a Death Cross happens when the short-term 50 MA crosses BELOW the long-term 200 MA.
This is interpreted as a strong bearish breakdown. It signals that short-term weakness has overcome the long-term trend, and sellers are firmly in control. In the context of cyclical sectors or overheated markets, this is often a warning sign of a deeper correction or a prolonged cyclical downtrend.
Quick Cheat Sheet
- What Happens: Golden Cross (50 MA over 200 MA) vs. Death Cross (50 MA under 200 MA)
- Signal: Golden Cross is Bullish vs. Death Cross is Bearish
- Action: Golden Cross is a Buy/Long signal vs. Death Cross is a Sell/Short signal
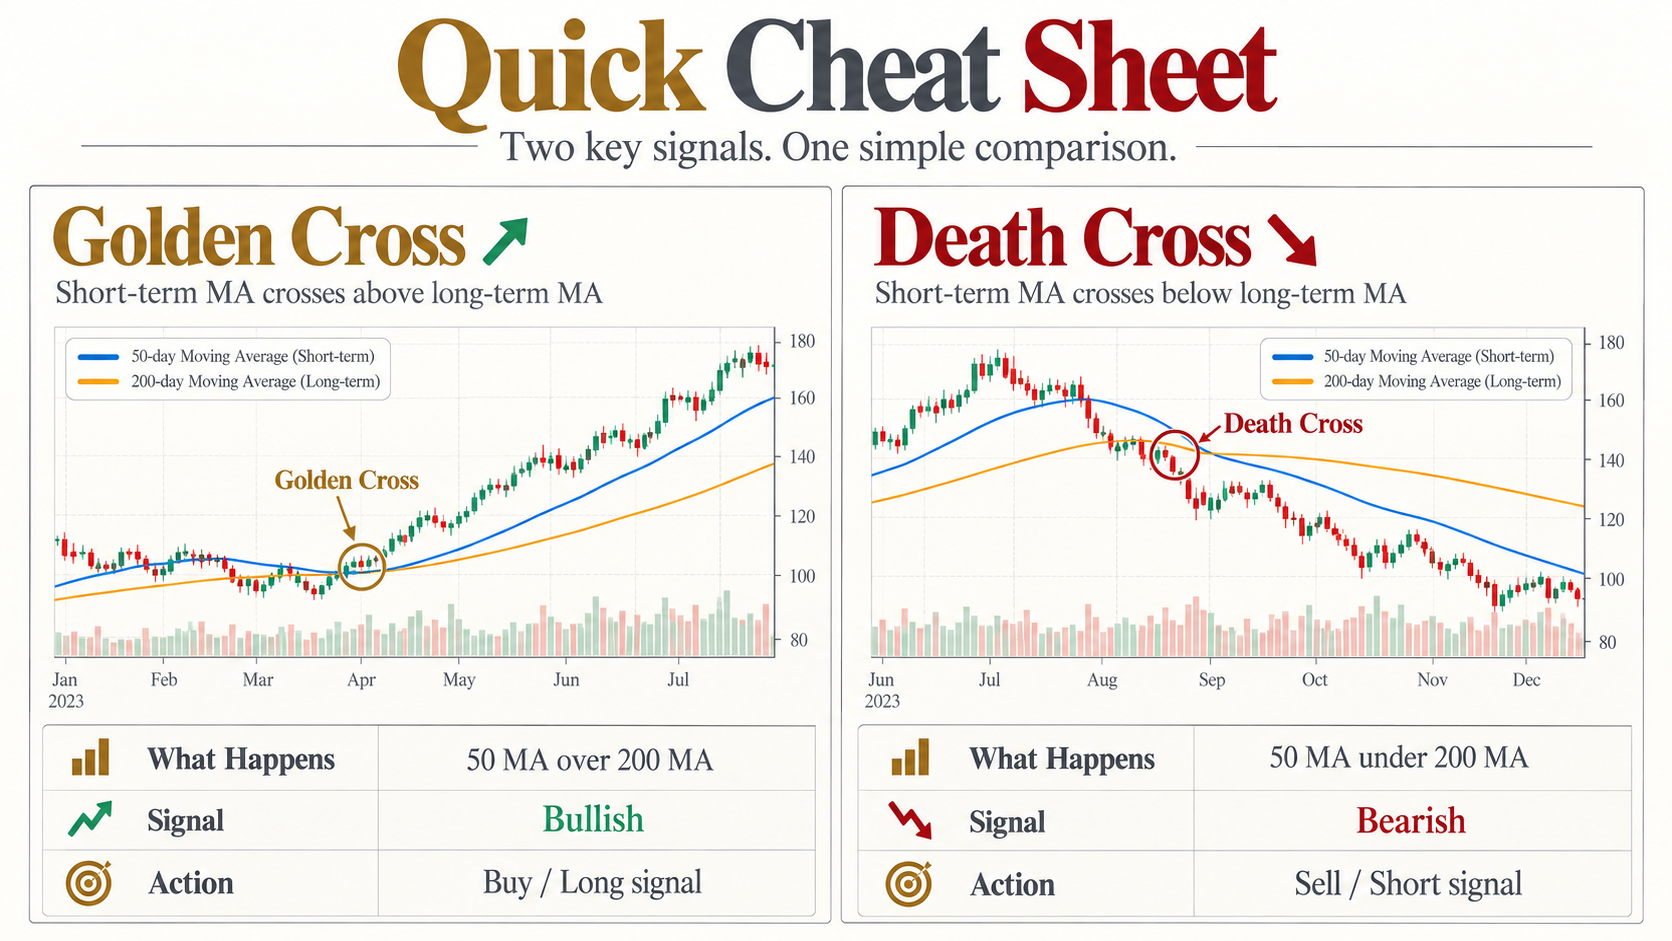
Important Note: Both indicators work best on higher timeframes like daily and weekly charts on your trading terminal. They are far less reliable and prone to false triggers on intraday timeframes.
The Catch: Don't Trade Them Blindly
Here is the most important reality check for any market participant: Both crossovers are lagging indicators. They confirm a trend change only *after* it has already started.
This means that by the time you spot a freshly minted Golden Cross on your screen, the underlying move may have already been underway for weeks. Entering too late can trap you at the very top of a cyclical move just as profit-booking begins. The same applies to the Death Cross—by the time the cross prints, the worst of the fall may already be over, and you could end up panic-selling or shorting the exact market bottom.
How to Actually Trade Them
Instead of treating the cross as a standalone buy or sell signal, smart traders use it as a confirmation tool. Here is how you can incorporate it into your strategy:
- Volume Check: Look for high trading volume on the NSE/BSE during the cross. A crossover accompanied by low volume is much less reliable and often leads to a false breakout.
- Wait for a Retest: Let the price pull back to test the 50 MA or 200 MA as support (in a Golden Cross) or resistance (in a Death Cross). This patient approach gives you a significantly better risk-to-reward entry point.
- Combine It: Use the crossover as a confluence tool to add to your existing trading strategy—such as RSI divergence or chart patterns—rather than making it the sole reason to enter a trade.
The Takeaway
The Golden Cross and Death Cross are powerful indicators, but they are not a crystal ball. They are inherently lagging, meaning they confirm established trends rather than predict future price action. If you trade them blindly, you risk getting trapped at the top or bottom of a market cycle.
Use them as part of a broader, well-rounded trading strategy. Combine them with volume analysis, wait for technical retests, and always manage your risk with strict stop-losses. Remember: a technical signal is only as good as the execution plan behind it.