



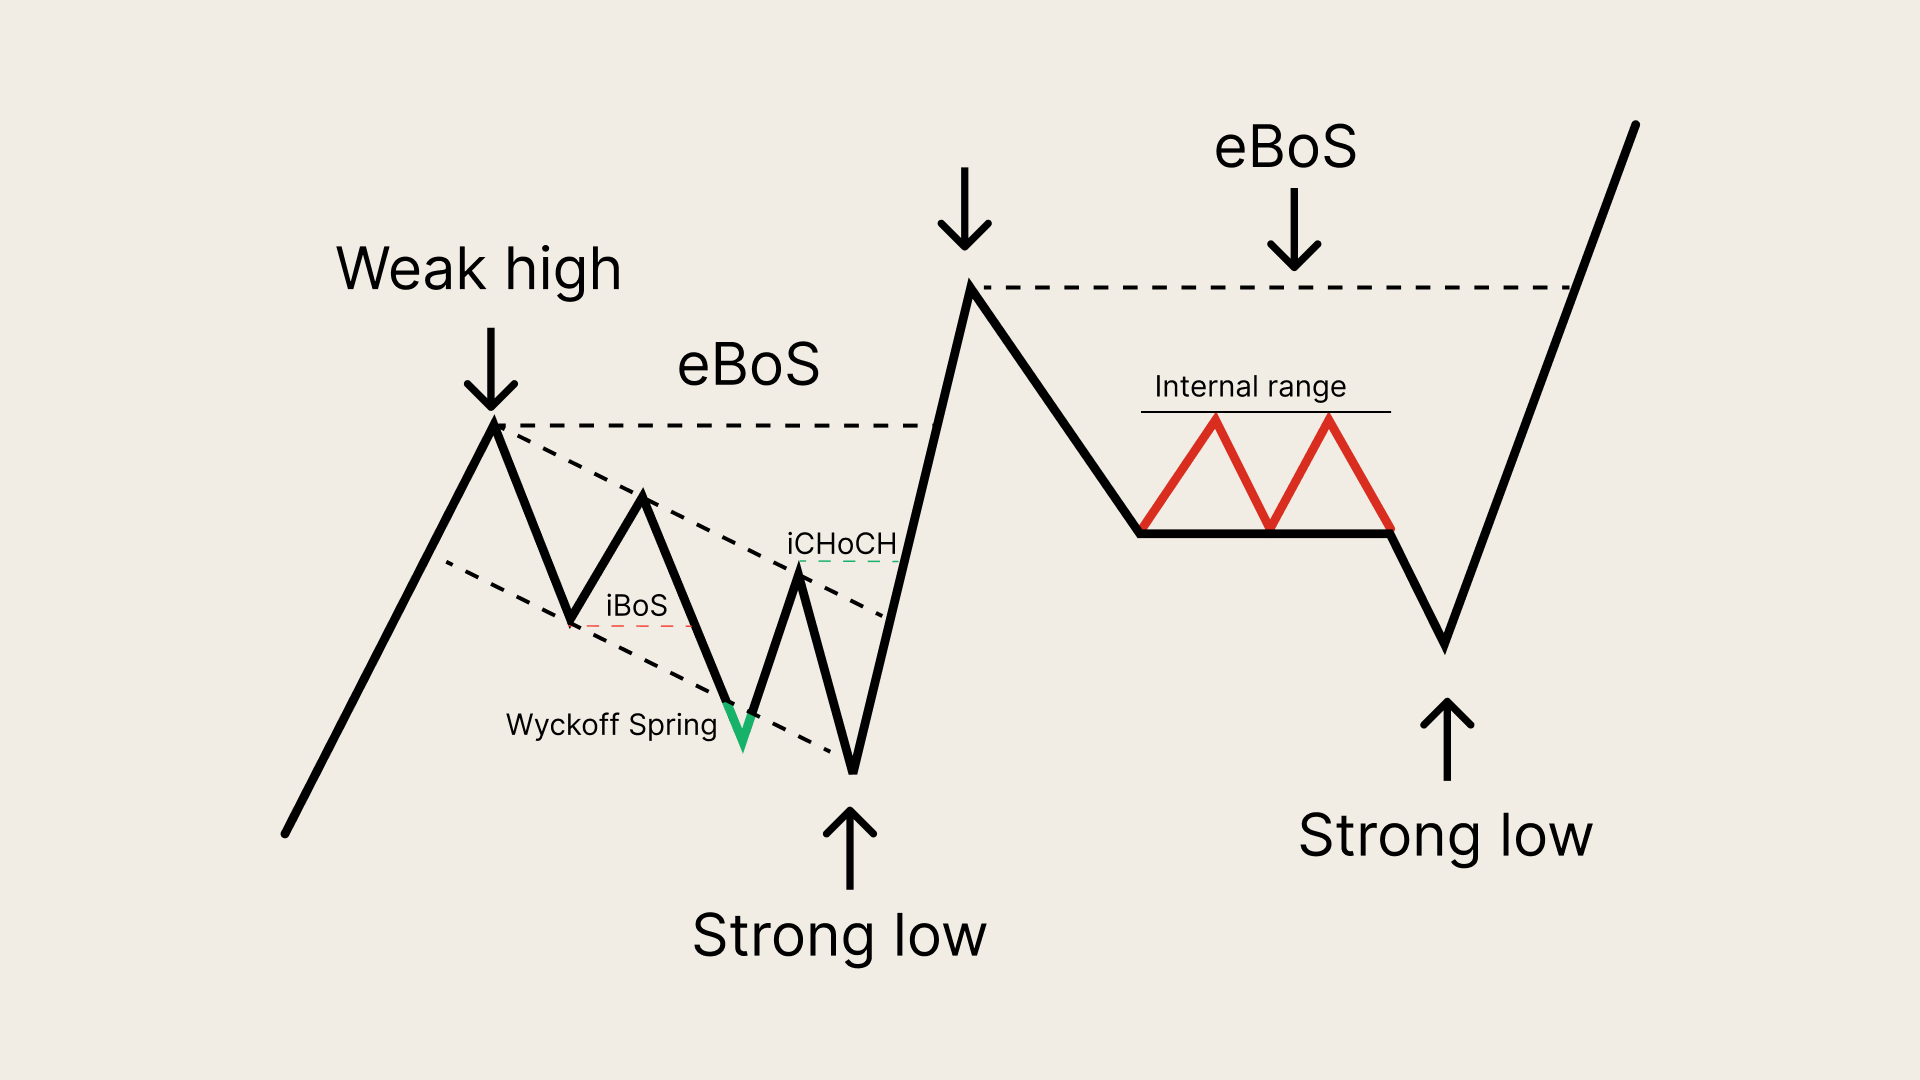
Most retail traders jump into the market looking for a magic indicator or a secret signal on their charts. Whether they are scanning Nifty 50 options or tracking Sensex bluechips, the search is usually the same: a complex formula that promises guaranteed entries. But the real edge isn't hidden in a lagging indicator—it's in understanding the basic story of price movement.
Market structure is simply the way price forms highs and lows over time. By observing these highs and lows on NSE or BSE charts, traders try to understand whether price is trending up, trending down, or whether the trend is changing. Here is how to decode it, step by step.
The Building Blocks: Swings
Price rarely moves in a straight line. It moves up and down, creating what are called Swing Highs and Swing Lows.
- Swing High: A peak where price moves up and then turns lower.
- Swing Low: A bottom where price moves down and then turns higher.
These swings are the fundamental building blocks of market structure. If you can't identify a swing on your timeframe, you can't read the market.
Bullish vs. Bearish Structure
Once you can identify swings, the next step is to connect them. This is where the story starts to emerge.
Bullish Structure (Uptrend):
- Higher High (HH): A new high above the previous swing high.
- Higher Low (HL): A new low above the previous swing low.
- HH + HL = Uptrend. When you see this pattern, the buyers are in control.
Bearish Structure (Downtrend):
- Lower Low (LL): A new low below the previous swing low.
- Lower High (LH): A new high below the previous swing high.
- LL + LH = Downtrend. When you see this pattern, the sellers are in control.
The Game-Changer: Market Structure Break (MSB)
The most powerful signal in market structure is a break. When price breaks a key swing level, the existing market structure is broken.
For example, in a downtrend on a prominent index, a break above the previous swing high can signal a potential shift in structure. This is called a Bullish Market Structure Break (MSB). The reverse applies in an uptrend.
Pero aquí está la trampa (Here is the catch): not every break equals a new trend. This is where most traders get trapped and end up giving back their profits.
What Happens After the Break?
Instead of immediately entering a trade after a break, smart traders watch for different scenarios:
- Retest of the Broken Level: Price pulls back to the previous swing level before continuing. This is often the highest-probability entry.
- Deeper Retracement: Price retraces further into the previous move (for example, into the Golden Zone Fibonacci level) before potentially continuing.
- No Retest: Price continues directly after the break without giving a clear pullback entry. This often results in a failed signal or a chase.
The Reality Check: Not Every Break Is a Trend
Here is the most important thing to remember for your trading journey:
- Focus on significant swings, not every small intraday move.
- Wait for confirmation and watch for false breakouts.
- A retest may not always happen.
- Always manage risk—structure isn't a guarantee.
The Takeaway
Market structure isn't a crystal ball. It's a framework for understanding the ongoing battle between buyers and sellers. When you learn to read swings, identify HH/HL and LL/LH patterns, and spot legitimate structure breaks, you stop guessing and start reading the story behind the price.
And in the fast-paced world of trading, understanding the story is the real edge.