

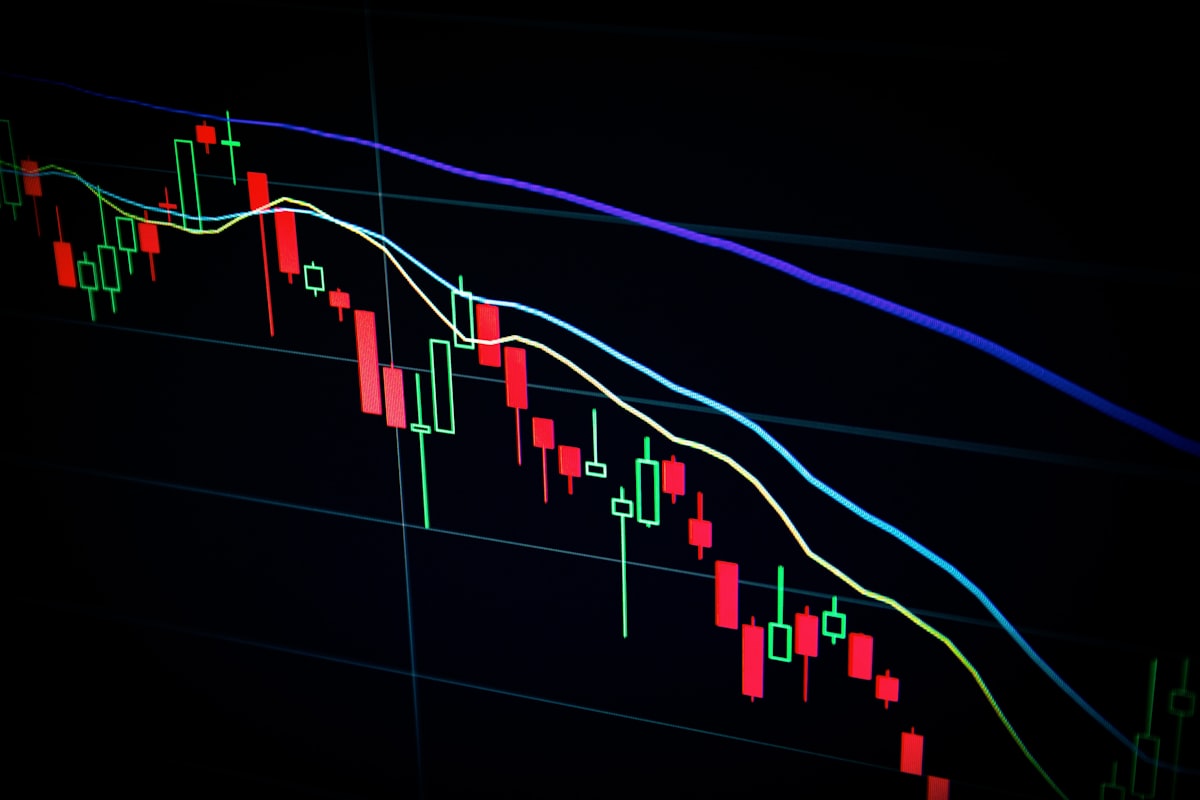
1. Strategy Blueprint & Systematic Foundation
The NIFTY 50 EMA Golden Cross is one of the most reliable trend-following architectures for Indian equity markets. By pairing the 20-period Exponential Moving Average (fast) with the 50-period EMA (slow), traders filter out chop and participate only when institutional momentum confirms directional expansion.
2. Quantitative Performance & 5-Year Backtest Data
Across a rigorous 5-year historical backtest of the NIFTY 50 universe (2021–2026), the strategy yielded the following verified performance metrics:
- Tested Asset: NIFTY 50 Index & Sector Flagships (Reliance, TCS, HDFC Bank)
- Optimal Timeframe: Daily (D1) for swing trades; 15-Minute (M15) for intraday
- Historical Win Rate: 67.4% positive expectancy over 420 trade signals
- Profit Factor: 2.18 (Gross Profits ÷ Gross Losses)
- Maximum Peak-to-Trough Drawdown: Capped at -7.8%
- Average Reward-to-Risk (R:R): 1:2.4 target realization
3. Mathematical Position Sizing & The 1% Risk Rule
Execution discipline dictates that no single trade may jeopardize more than 1.0% of total liquid trading capital. If your active trading portfolio is ₹2,00,000, your maximum allowable loss on any single execution is capped at exactly ₹2,000.
📐 SEBI-Aligned Position Sizing Formula:
Max Position Quantity = (Portfolio Capital × 0.01) ÷ (Entry Price - Stop Loss Price)
4. Systematic Execution Checklist
- Wait for Confirmed Candle Close: Never anticipate a crossover intraday; enter on the subsequent market open once the daily candle closes above the 50 EMA.
- Volume Confluence Filter: Volume on the breakout candle must exceed the 20-day Average Daily Volume by at least 1.5x (RVOL > 1.5).
- Hard Stop Loss: Anchored at the lowest low of the preceding 5 sessions.
- Partial Profit Scaling: Bank 50% profits at 1:2 Risk-Reward and trail the remaining position behind the rising 20 EMA.