



A breaking headline hits the terminal, and a marquee Indian bluechip stock goes flying on the NSE. The chart flashes a massive green candle, volume spikes across the board, and finfluencers on social media start screaming about a generational breakout. You jump in with FOMO—and then the market reverses. Hard.
It is one of the most punishing traps in modern trading. A transient price spike and a genuine structural breakout can look identical in the heat of the moment. However, they are fundamentally different market phenomena, and mastering the distinction can save your trading capital from a world of pain.
Spike vs. Close: The Temperature Test
A price spike represents the absolute furthest extreme price travels during a trading session. While fast, emotional, and visually dramatic, it offers zero guarantee that the move has staying power. The daily market close, conversely, reveals where prices actually settled—demonstrating whether institutional heavyweights were willing to defend and stick with the move.
Think of it like checking the weather temperature at noon. The reading is real, but it doesn't tell you how the entire day will play out. A Nifty 50 constituent can spike to a fresh record high in the morning session only to close deep in the red by the closing bell due to institutional profit-booking. The close is always the final verdict.
A Real-World Market Example: WTI Crude and NSE Indices
Consider how this plays out in high-beta assets. During a volatile geopolitical session, crude oil might crash 2.5% in early electronic trading, touching session lows that trigger widespread panic. The morning move looks aggressively bearish, tempting retail traders to aggressively short the breakdown.
Yet, by the European or U.S. afternoon close, systematic buying steps in, recovering the entire drop and finishing near session highs. The morning panic was a fakeout. If you had reacted purely to the intraday spike and shorted the asset, you would have been severely burned. The same dynamic plays out daily on Dalal Street—whether it's Bank Nifty testing crucial psychological supports or a midcap stock squeezing short sellers.
Why the Spike Lies
So why do price spikes happen so frequently, and why do they trap so many market participants? There are three structural reasons:
- Algorithmic speed over intelligence: The initial reaction to news is driven by high-frequency trading (HFT) algorithms and momentum momentum-chasers who react before fundamental analysis can even be processed. Their directive is pure speed, not accuracy.
- Exhaustion of liquidity: Extreme, parabolic moves rapidly run out of fuel. The further price stretches from its fair value, the fewer institutional buyers remain willing to chase it. Eventually, the buying vacuum collapses.
- Cascading stop-losses: When clustered stop orders—sitting just above a key resistance or below a support—are triggered, price forcibly shoots through the level. This mimics a true breakout, but it is merely a temporary burst of forced liquidation rather than organic accumulation.
Rejection or Confirmation?
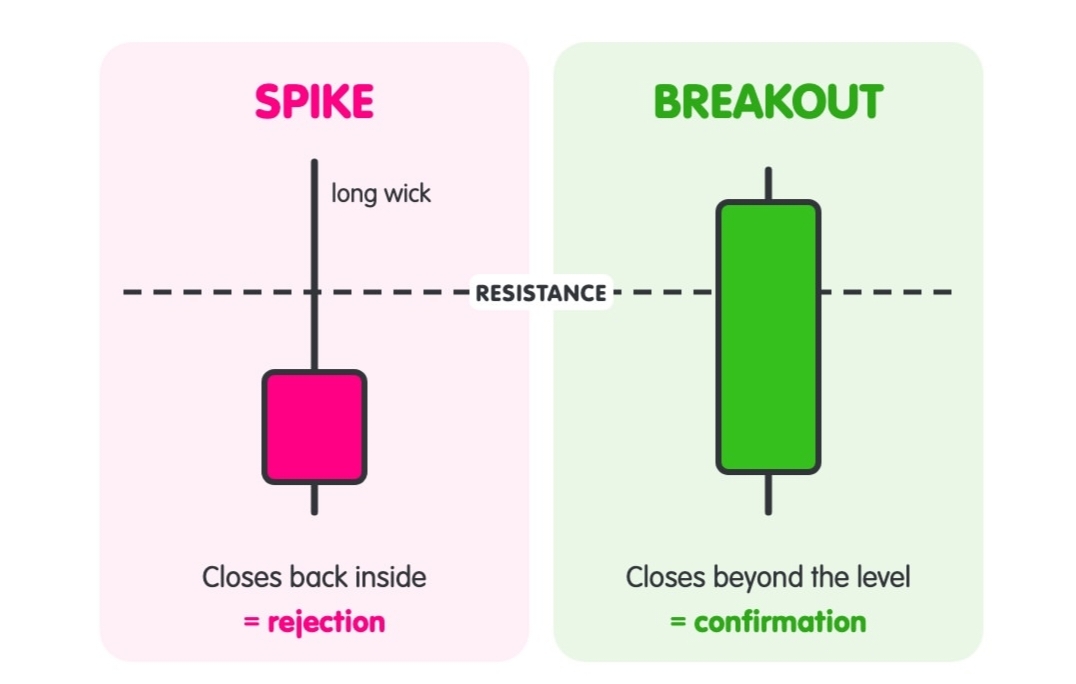
This remains the single most critical distinction in technical analysis. A technical level is only respected when price achieves a decisive close beyond it, rather than a fleeting intraday breach.
- Spike (Rejection): Price prints a long wick, aggressively pushes above a resistance line, but ultimately closes back inside the previous range. This constitutes a textbook rejection. The level held firm.
- Breakout (Confirmation): Price closes cleanly beyond the barrier. This provides confirmation that the structural supply zone was genuinely absorbed and broken.
The visual variance on a candlestick chart can be subtle, but the portfolio implications are massive. A long upper shadow (wick) is an institutional warning sign of failure. A strong, body-heavy close is a sign of continuation success.
How Much of the Session Is Left?
Timing matters far more than retail traders realize. A sudden price spike at 9:20 a.m. right after the opening bell on the NSE still has hours of open market dynamics left to completely reverse. Conversely, a breakout move that maintains its momentum with only 30 minutes left in the trading session carries exponentially higher institutional weight.
Consider major macroeconomic releases, such as Reserve Bank of India (RBI) policy rate announcements or U.S. Nonfarm Payroll data. Currency pairs and index futures can react violently within seconds, but the initial knee-jerk move is rarely the one that sustains. The real signal is whether the initial spike holds its ground into the closing bell.
The Takeaway
A price spike is temporary noise; a real breakout is a structural signal. The difference always lies in the closing price, the underlying macro context, and the time of day the move occurs. Before you chase a fast-moving green candle on your screen, ask yourself one simple question: Did the asset close beyond the level, or did it merely touch it? Your trading account's survival depends on the answer.