



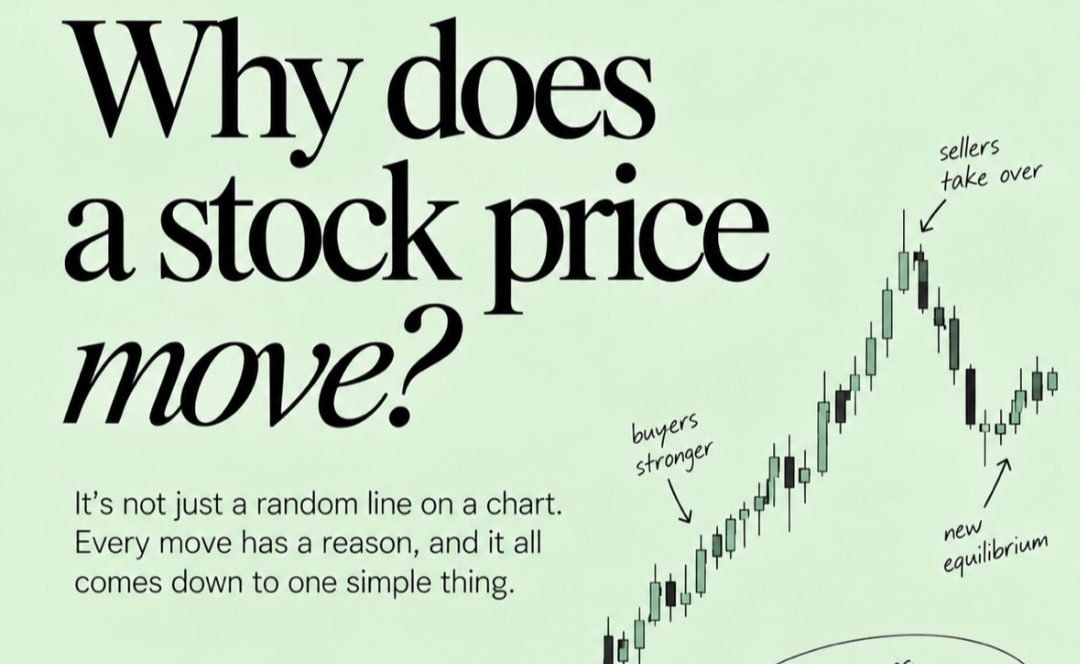
If you watch the Indian stock market for long enough—tracking the movements of the Nifty 50 or Sensex on your terminal—it can start to look like a random line squiggling up and down on a screen. But it's not random. Every tick on the NSE or BSE has a reason, and it all comes down to one simple thing. Understanding this one concept will change how you look at charts forever. It won't just be a line anymore—it will be a story of a battle.
The Battle Between Buyers and Sellers
A stock price moves because buyers and sellers disagree on its value. That's it. That's the whole game.
When buyers are stronger, demand increases. More people want to buy than sell, and the price moves up. You'll see a series of green candles with higher highs and higher lows on your bluechip counters.
When sellers are stronger, supply increases. More people want to sell than buy, and the price moves down. You'll see a series of red candles with lower highs and lower lows.
The market is constantly trying to find a balance. Prices keep moving as new retail investors, institutional giants, and foreign portfolio investors (FPIs) enter the market, each with different opinions, information, and expectations.
What a Chart Actually Shows
A chart is not just a line going up and down. It's a visual record of the battle between buyers and sellers.
Every single candle tells a story. It shows who was stronger in that period—buyers or sellers—and by how much.
- Price Movement: Shows the outcome of the battle.
- Candle Size: Shows the strength of the buyers or sellers.
- Wicks: Show the rejection at certain price levels.
A long wick, for example, means one side tried to take control but couldn't sustain it. The other side stepped in and pushed the price back.
How to Read the Battle on a Real Chart
Here is how this shows up on a real chart:
- Up Moves: A series of green candles with higher highs and higher lows shows buyers are in control.
- Down Moves: A series of red candles with lower highs and lower lows shows sellers are in control.
- Volume Confirms Strength: Higher volume on an up move shows stronger buying interest. Higher volume on a down move shows stronger selling pressure.
- Wicks Show Rejection: Long wicks mean the opposite side tried to take control but couldn't sustain it.
A chart is simply a visual representation of supply and demand in action. Each candle shows what buyers and sellers did in that period, and the overall pattern shows who was stronger.
The Takeaway
The next time you look at a chart on TickerPulse, don't just see lines. See the battle. See the buyers stepping in, the sellers taking over, and the constant tug-of-war for equilibrium. Because once you understand that price moves because buyers and sellers disagree, you stop guessing and start reading the story of the market.