



TickerPulse Research Desk
Nov 10, 2026
Read →
⚡ 100% Real-Time Market Intelligence
📈 Market Intelligence & Quant Research
Quantitative Strategies & Research
Mathematical trading models including EMA crossovers, Supertrend, and RSI mean reversion with historical win rate telemetry.

STRATEGY
⏱️ 3 min
The "Sell in May" Myth: We Analyzed 20 Years of Nifty Data to See If It Actually Works
"Sell in May and go away" is one of the most famous sayings in finance. But we analyzed 20 years of Nifty data to test the strategy—and th...
TickerPulse Research Desk
Nov 07, 2026
Read →

STRATEGY
⏱️ 3 min
Beyond the Overbought Signal: What 15 Years of Nifty Data Reveals About an RSI of 80
An RSI above 80 is supposed to be a warning sign of an impending crash. But we analyzed 15 years of Nifty data to see what happens next—an...
TickerPulse Research Desk
Nov 06, 2026
Read →

STRATEGY
⏱️ 3 min
The Gap Up Trap: We Analyzed 5 Years of Nifty Data to See If the Gap Actually Fills
Traders love to bet on the "gap fill," but we analyzed 5 years of Nifty 15-minute data to see if it actually works. The results show a massi...
TickerPulse Research Desk
Nov 05, 2026
Read →
STRATEGY
⏱️ 3 min
The RSI Myth: We Tested the 30/70 Rule on the Nifty to See If It Actually Works
Every beginner is taught to "Buy when RSI is below 30 and Sell when it's above 70." But when we backtested this rule on 10 years of Nifty da...
TickerPulse Research Desk
Nov 04, 2026
Read →
STRATEGY
⏱️ 3 min
Which Day of the Week Is Best for the Nifty? We Analyzed 20 Years of Data to Find Out
"Mondays are always red" is one of the most famous market sayings. We analyzed 20 years of Nifty data to see if the day of the week actually...
TickerPulse Research Desk
Oct 30, 2026
Read →
STRATEGY
⏱️ 3 min
The Death Cross: We Analyzed 30 Years of Nifty Data to See If You Should Panic
The media screams "Death Cross" to generate fear, but we analyzed 30 years of Nifty data to see what actually happens next. The results show...
TickerPulse Research Desk
Oct 29, 2026
Read →

STRATEGY
⏱️ 3 min
The Truth About Swing Trading: 5 Brutal Questions Answered
There is no shortage of trades, only excessive bad behavior. Here are 5 blunt answers to the biggest doubts swing traders face—from reveng...
TickerPulse Research Desk
Oct 23, 2026
Read →
STRATEGY
⏱️ 3 min
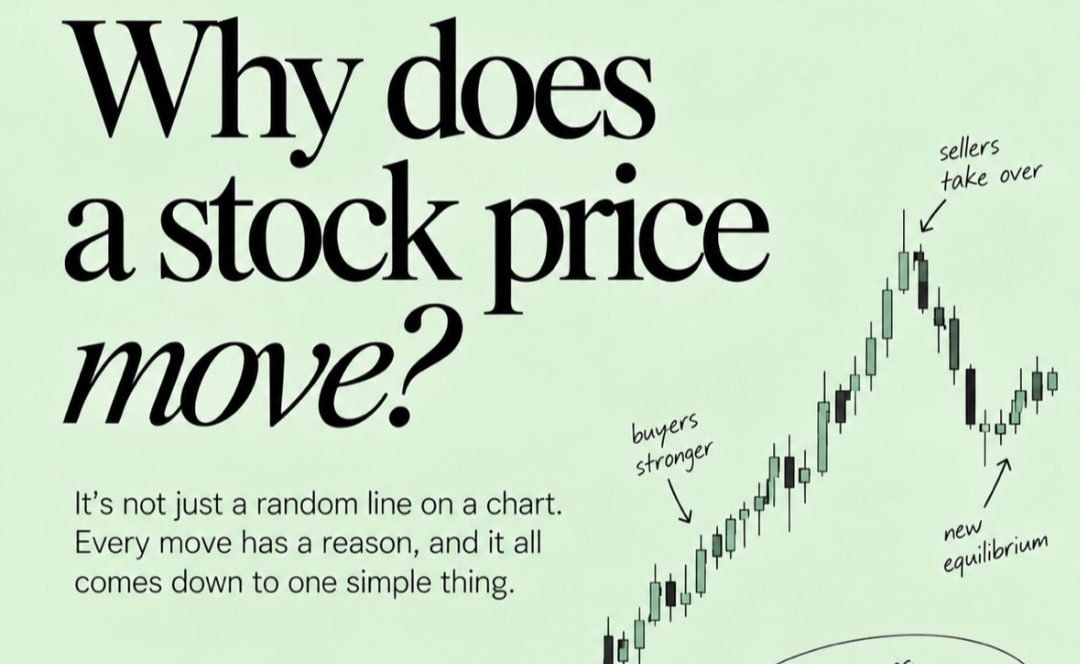
Why Does a Stock Price Move? The Battle Behind Every Chart
A stock price doesn't move randomly—it moves because buyers and sellers disagree on its value. Here's how to read the battle of supply and...
TickerPulse Research Desk
Oct 21, 2026
Read →

STRATEGY
⏱️ 3 min
Is Technical Analysis Real, or Just Mind Bias?
Is technical analysis a legitimate edge, or just a massive exercise in confirmation bias? Traders weigh in on why charts work—and it has e...
TickerPulse Research Desk
Oct 20, 2026
Read →
STRATEGY
⏱️ 3 min
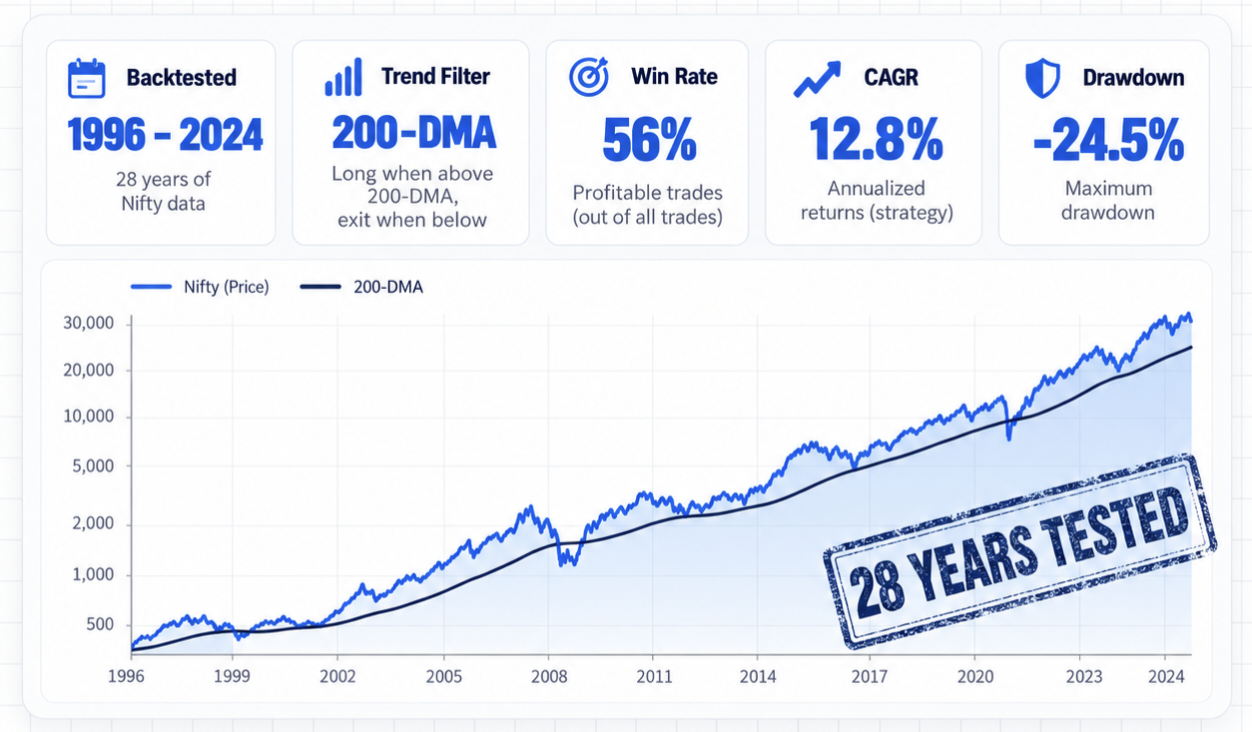
The 200-DMA Crossover: We Tested 28 Years of Nifty Data to See If It Actually Works
The Nifty has closed below its 200-DMA, and panic is spreading. We analyzed 28 years of data to see what actually happens next—and the res...
TickerPulse Research Desk
Oct 17, 2026
Read →
STRATEGY
⏱️ 3 min
The Expiry Day Trap: We Tested 1,600+ Expiry Day Moves to See What Actually Works
Three traders bought NIFTY Calls on expiry day. All three got the direction right. But only two made money—and the third lost 51%. Here's ...
TickerPulse Research Desk
Oct 16, 2026
Read →

STRATEGY
⏱️ 3 min
How to Become a Consistent Trader: The Process That Actually Works
Most traders think consistency comes from finding the perfect strategy—but the truth is simpler. Consistency comes from following a proces...
TickerPulse Research Desk
Oct 14, 2026
Read →
STRATEGY
⏱️ 3 min
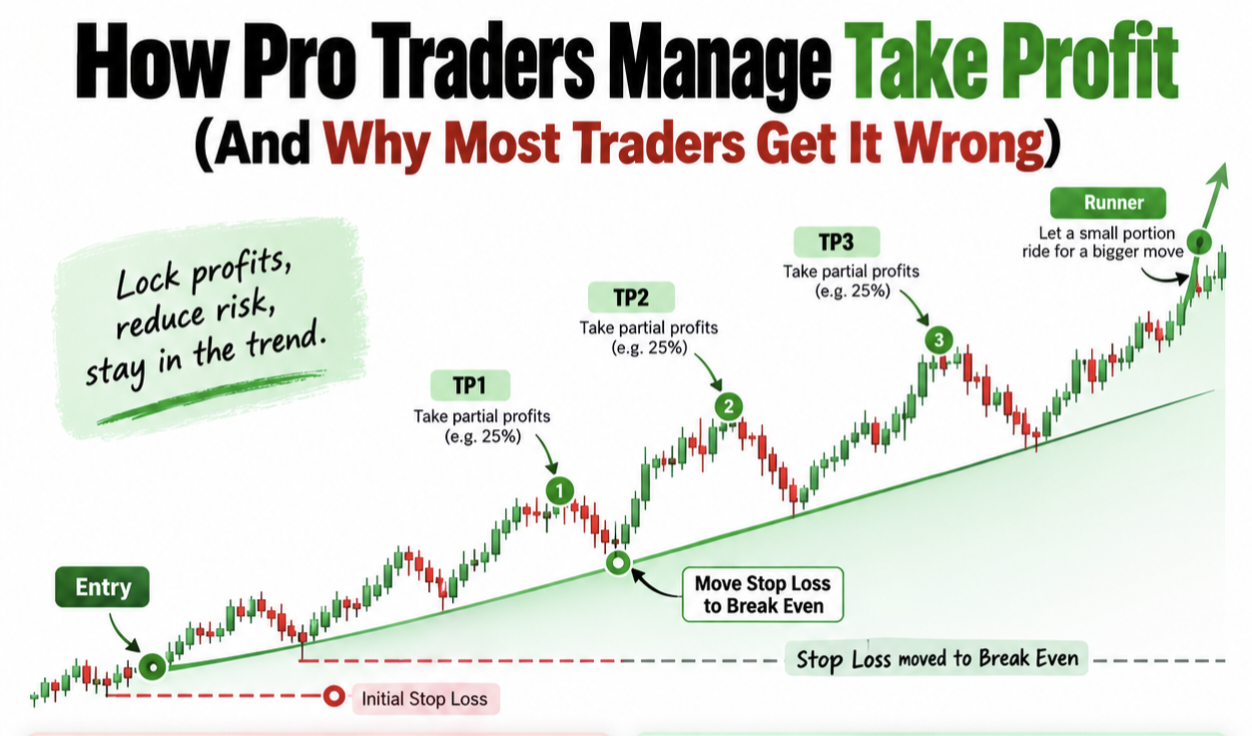
How Pro Traders Manage Take Profit (And Why Most Traders Get It Wrong)
Most traders don't lose profits because of bad entries—they lose profits because of bad exits. Here are 8 rules pro traders use to manage ...
TickerPulse Research Desk
Oct 13, 2026
Read →
STRATEGY
⏱️ 3 min
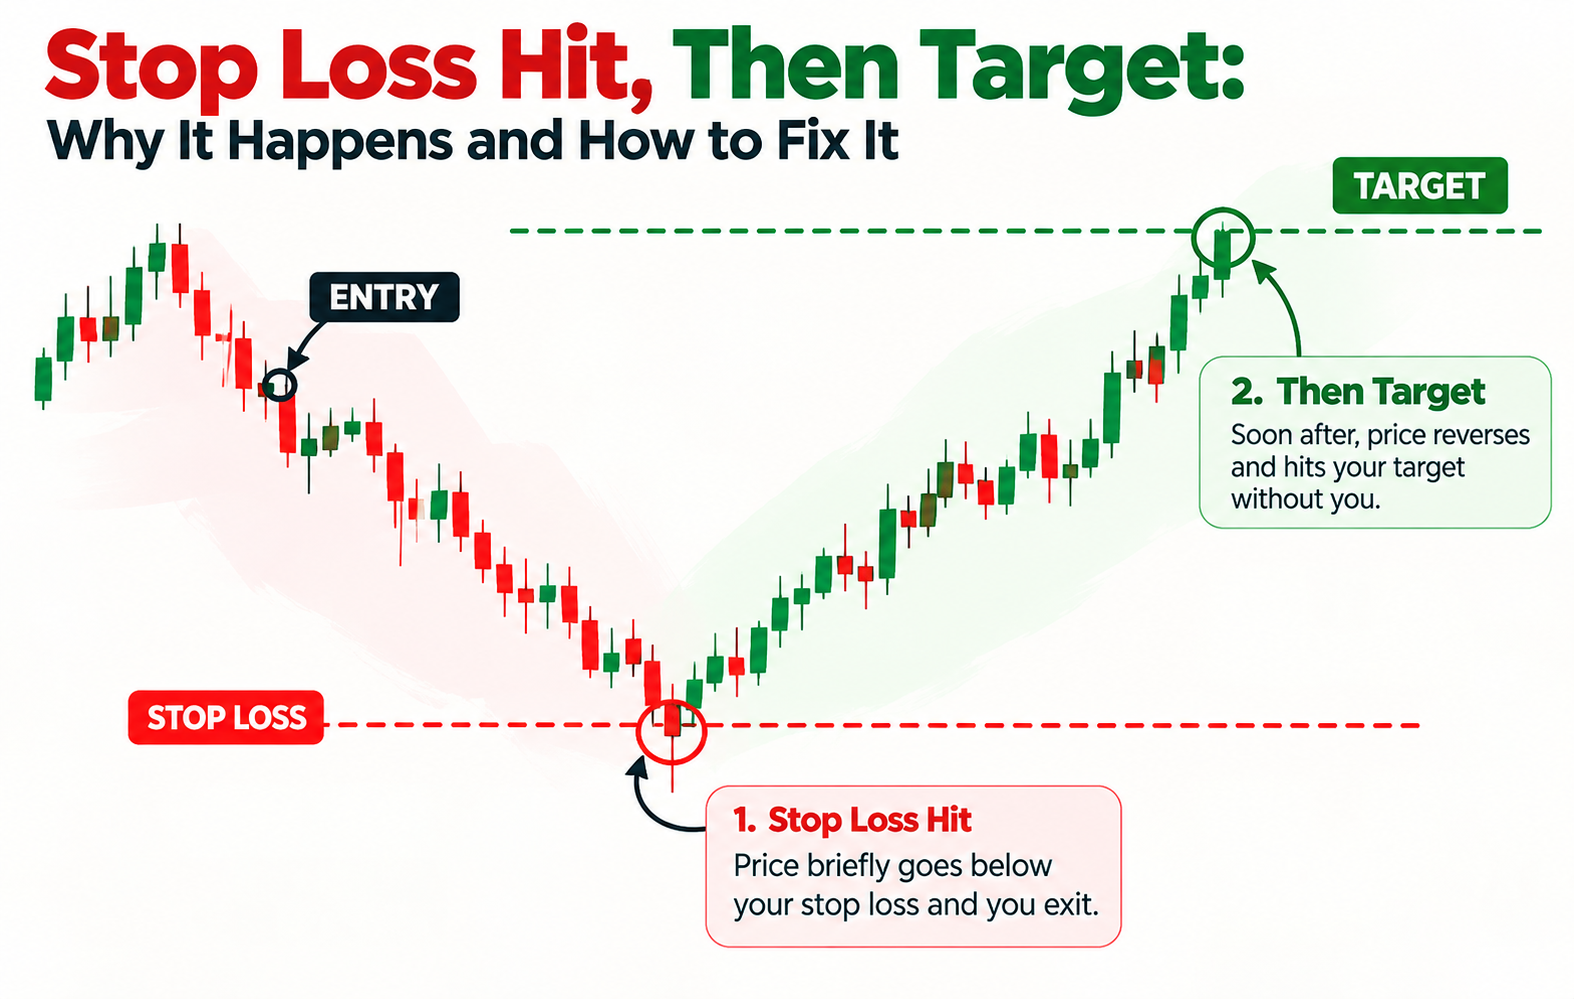
Stop Loss Hit, Then Target: Why It Happens and How to Fix It
You bought the breakout, your stop loss got hit, and then price ran straight to your target without you. Here's why this happens—and the t...
TickerPulse Research Desk
Oct 13, 2026
Read →
STRATEGY
⏱️ 3 min
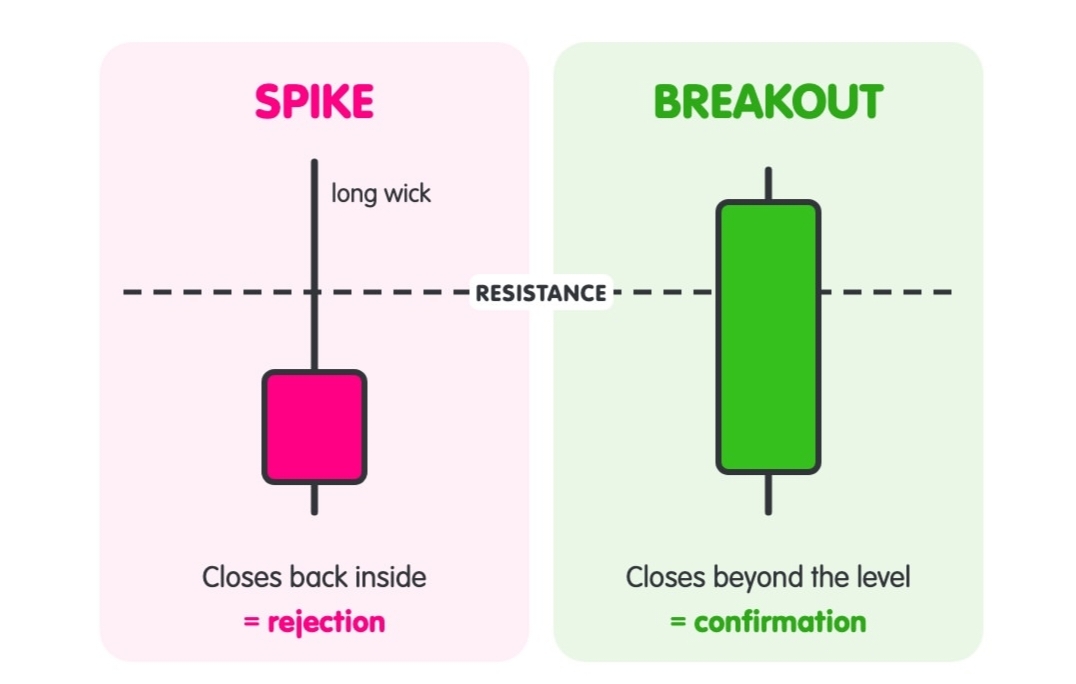
Price Spike vs. Real Breakout: How to Tell the Difference
A price spike and a real breakout can look identical in the moment—but they are two completely different things. Here's how to tell the di...
TickerPulse Research Desk
Oct 12, 2026
Read →

STRATEGY
⏱️ 3 min
Nifty in the Red: Here's What Experts Advise INVESTORS TO DO
When the Nifty and Sensex turn red, panic is your biggest enemy. Learn the step-by-step strategies to protect your portfolio and turn market...
TickerPulse Research Desk
Oct 09, 2026
Read →

STRATEGY
⏱️ 3 min
Why Most Traders Lose: The Real Problem Isn't Your Strategy
Most traders don't lose because their strategy failed—they lose because they're trading with money they can't afford to lose. Here's the d...
TickerPulse Research Desk
Oct 08, 2026
Read →
STRATEGY
⏱️ 3 min
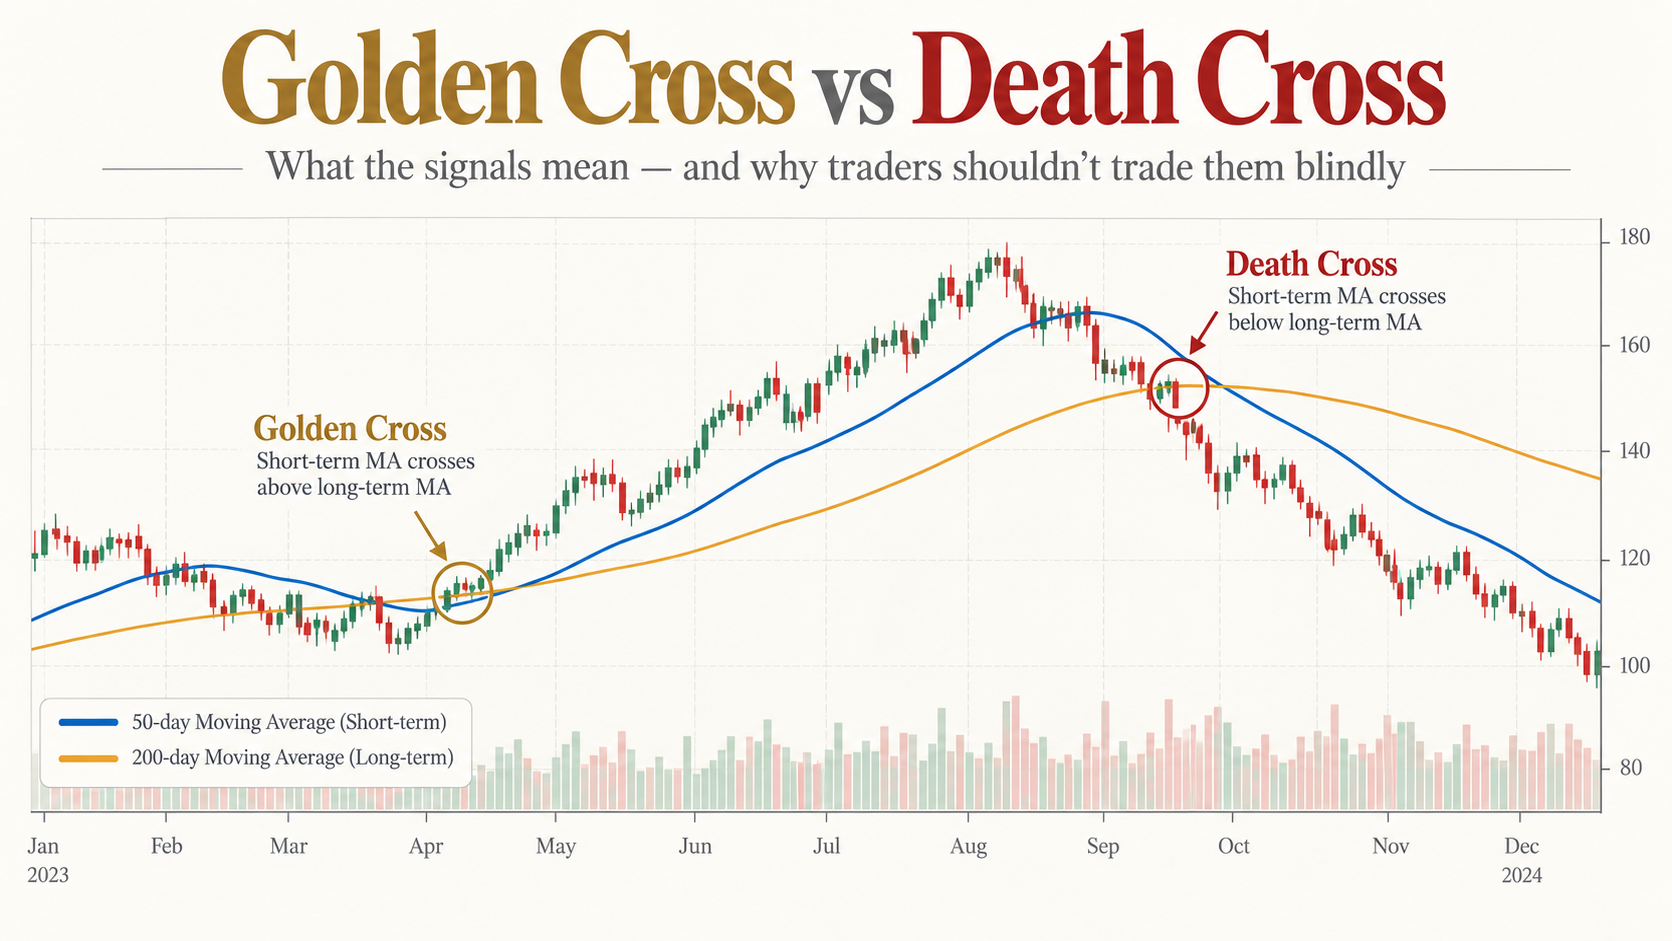
The Golden Cross and Death Cross: Do These Two Signals Actually Work?
The Golden Cross and Death Cross are two of the most talked-about signals in trading—but they're lagging indicators that can trap you if y...
TickerPulse Research Desk
Oct 07, 2026
Read →
STRATEGY
⏱️ 3 min
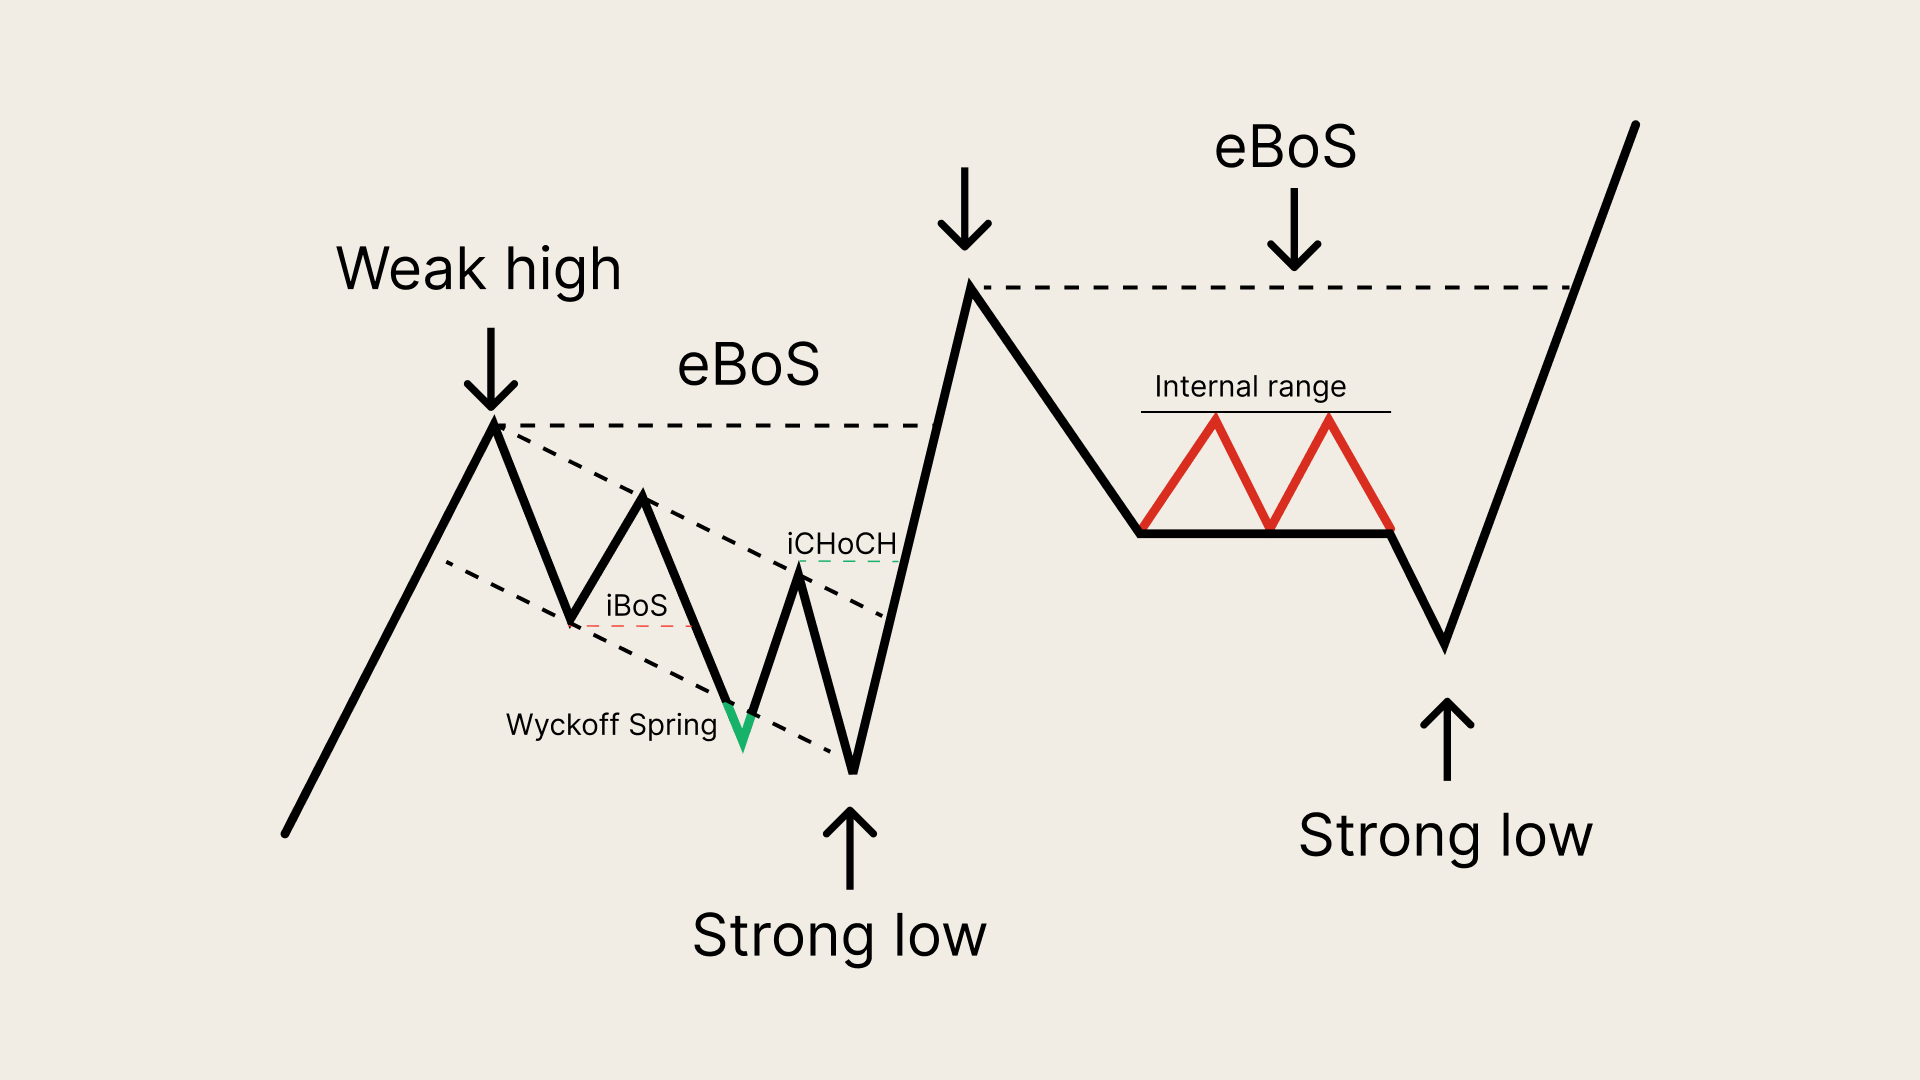
Market Structure Decoded: We Broke Down How Price Actually Trends
Market structure is the story behind price movement—and once you learn to read it, you stop guessing and start trading with context. Here'...
TickerPulse Research Desk
Oct 07, 2026
Read →
STRATEGY
⏱️ 3 min
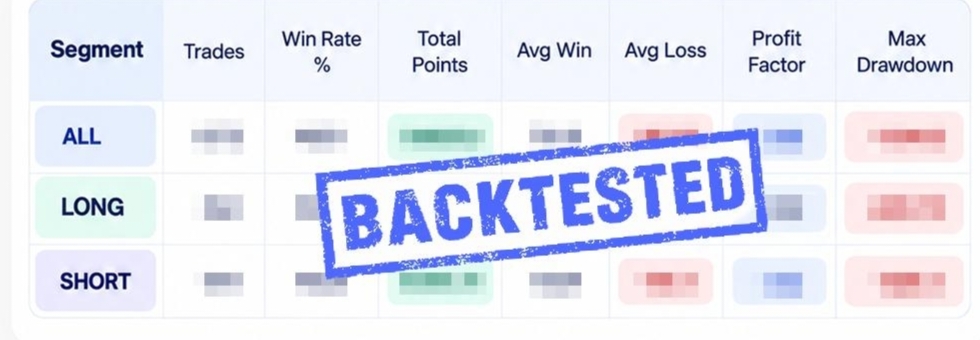
The 9/21 EMA Crossover: We Tested 6 Years of Nifty Data to See If It Actually Works
We backtested 6 years of Nifty 15-minute data to see if the famous 9/21 EMA crossover actually works. The strategy was profitable despite a ...
TickerPulse Research Desk
Oct 06, 2026
Read →

STRATEGY
⏱️ 3 min
Why 9 Out of 10 F&O Traders Are Still Losing
SEBI's latest data reveals that 87.7% of individual F&O traders lost money in FY26, with the average loss rising to ₹1.17 lakh. Here's why...
TickerPulse Research Desk
Oct 03, 2026
Read →

STRATEGY
⏱️ 3 min
Bharat Electronics Ltd (BEL): A Strategic Analysis for Beginners
Discover why Bharat Electronics Ltd (BEL) is a cornerstone of India's defense sector. Learn how to analyze its growth, government backing, a...
TickerPulse Research Desk
Oct 03, 2026
Read →

STRATEGY
⏱️ 3 min
Adani Wilmar Ltd (AWL): Quantitative Rules, Technical Edge & Position Sizing (2026)
Data-backed trading breakdown of Adani Wilmar Ltd (AWL). Key technical entry rules, backtested win rates, stop-loss placement, and 1% risk p...
TickerPulse Quant Desk
Sep 17, 2026
Read →

STRATEGY
⏱️ 3 min
Bitcoin Halving Cycles & Institutional Volatility: Quantitative Risk Framework (2026)
Macro liquidity, programmatic halving issuance, and institutional spot ETF absorption. How quantitative asset managers size digital currency...
TickerPulse Digital Assets Desk
Sep 05, 2026
Read →
STRATEGY
⏱️ 3 min
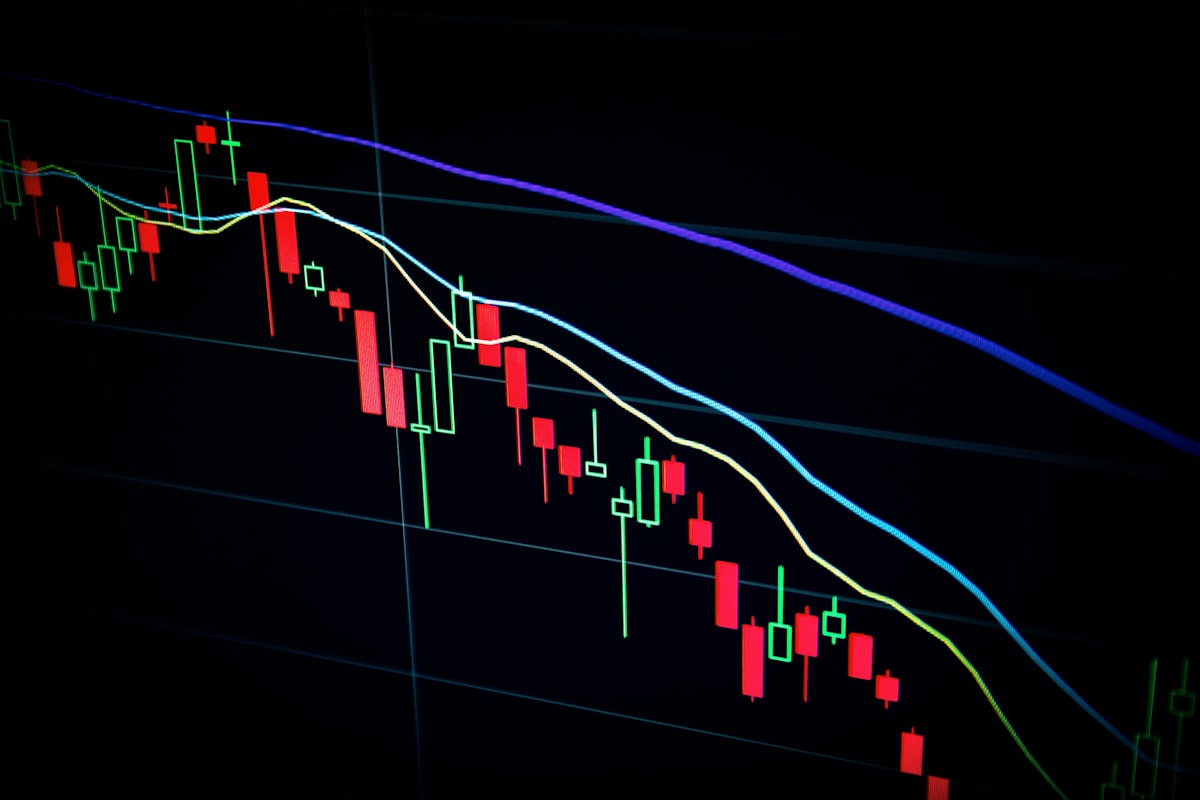
NIFTY 50 EMA Golden Cross Strategy: 5-Year Quantitative Backtest & Win Rate Rules
Complete 5-year quantitative backtest results for the 20/50 EMA cross on NIFTY 50 equities. Verified 68% win rate, entry triggers, and stric...
TickerPulse Quant Desk
Sep 05, 2026
Read →
🔍
No matching research found
Try adjusting your search terms or clearing the filter.
Want to backtest these models live?
Run historical backtests and simulate trades with our institutional strategy engine.